python
import numpy as np
import matplotlib.pyplot as pltpython
origin = np.array([0, 0])
v = np.array([4, 1])
w = np.array([-2, 2])
v_plus_w = v + w
v_minus_w = v - wpython
print(v)
print(w)
print(v_plus_w)
print(v_minus_w)[4 1]
[-2 2]
[2 3]
[ 6 -1]
python
plt.quiver(
    *origin,
    *v,
    color='r',
    angles='xy',
    scale_units='xy',
    scale=1,
    label='v = (4, 1)'
)

plt.quiver(
    *origin,
    *w,
    color='b',
    angles='xy',
    scale_units='xy',
    scale=1,
    label='w = (-2, 2)'
)

plt.quiver(
    *origin,
    *v_plus_w,
    color='g',
    angles='xy',
    scale_units='xy',
    scale=1,
    label='v + w = (2, 3)'
)

plt.quiver(
    *origin,
    *v_minus_w,
    color='y',
    angles='xy',
    scale_units='xy',
    scale=1,
    label='v - w = (6, -1)'
)

# Add dotted lines to form the parallelogram
plt.plot([v[0], v_plus_w[0]], [v[1], v_plus_w[1]], linestyle='dotted', color='k')
plt.plot([w[0], v_plus_w[0]], [w[1], v_plus_w[1]], linestyle='dotted', color='k')

plt.grid()
plt.xlim(-2, 6)
plt.ylim(-2, 6)
plt.axhline(y=0, color='k', linestyle='-', alpha=0.3)
plt.axvline(x=0, color='k', linestyle='-', alpha=0.3)
plt.title('2D Vectors in a Plane')
plt.xlabel('x')
plt.ylabel('y')
plt.legend()
plt.show()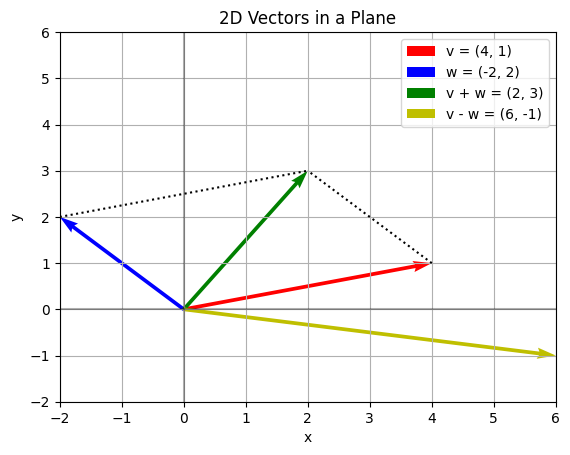
python